Title:Future Changes of Subseasonal Precipitation Variability in North America During Winter Under Global Warming
标题:在全球变暖的背景下北美地区冬季次季节降水未来的变化情况
作者:Lu Dong ; L. Ruby Leung ; Fengfei Song ; (PNNL, Atmospheric Sciences and Global Change Division, Pacific Northwest National Laboratory, Richland, Washington, USA)
期刊:JGR , 2018
Abstract:
Changes in subseasonal precipitation variability have important implications for predictability of weather and climate extreme. Here we explore the mechanisms that lead to future changes in subseasonal precipitation variability in North America during winter based on 20 state-of-the-art climate models. Modeling evidences indicate that in a warmer climate, the subseasonal precipitation variability consistently increases over most of North America, with intensified swing between the wet and dry extremes, but declines over Mexico. Using a moisture budget decomposition framework, two opposing mechanisms are established: the thermodynamic component from increasing moisture due to global warming intensifies the subseasonal precipitation variability, while the dynamic component from the projected reduction in subseasonal rainfall-related circulation variability has an opposite effect. Overall, the thermodynamic effect wins the tug of war at the mid-to-high latitudes over most of North America, while the dynamic effect overwhelms the thermodynamic effect in Mexico, creating distinct changes in subseasonal precipitation variability.
原文摘要:
次季节降水变率的变化对于极端天气和气候的可预报性有重要的影响。基于20个先进的气候模式来探究导致北美地区冬季次季节降水未来变化的机制。模拟结果证实在更暖的气候下,次季节降水变率在北美的多数地区都会一致地增加,使得极端的干、湿状态更趋极端化。但是,唯独在墨西哥地区是趋于缓和的。利用水汽收支分解的方案来分析,存在两种相对立的机制得以建立:由于全球变暖引起的水汽增加的热动力分量会增强次季节降水变率,但是与大气环流变率相关的次季节降水变率在未来预估中减少的动力分量则有相反的作用。总之,热动力作用在北美中高纬度地区的拉锯战中有较多优势,而动力作用在墨西哥地区有压制优势,因而次季节降水呈现出明显的差异。
图文
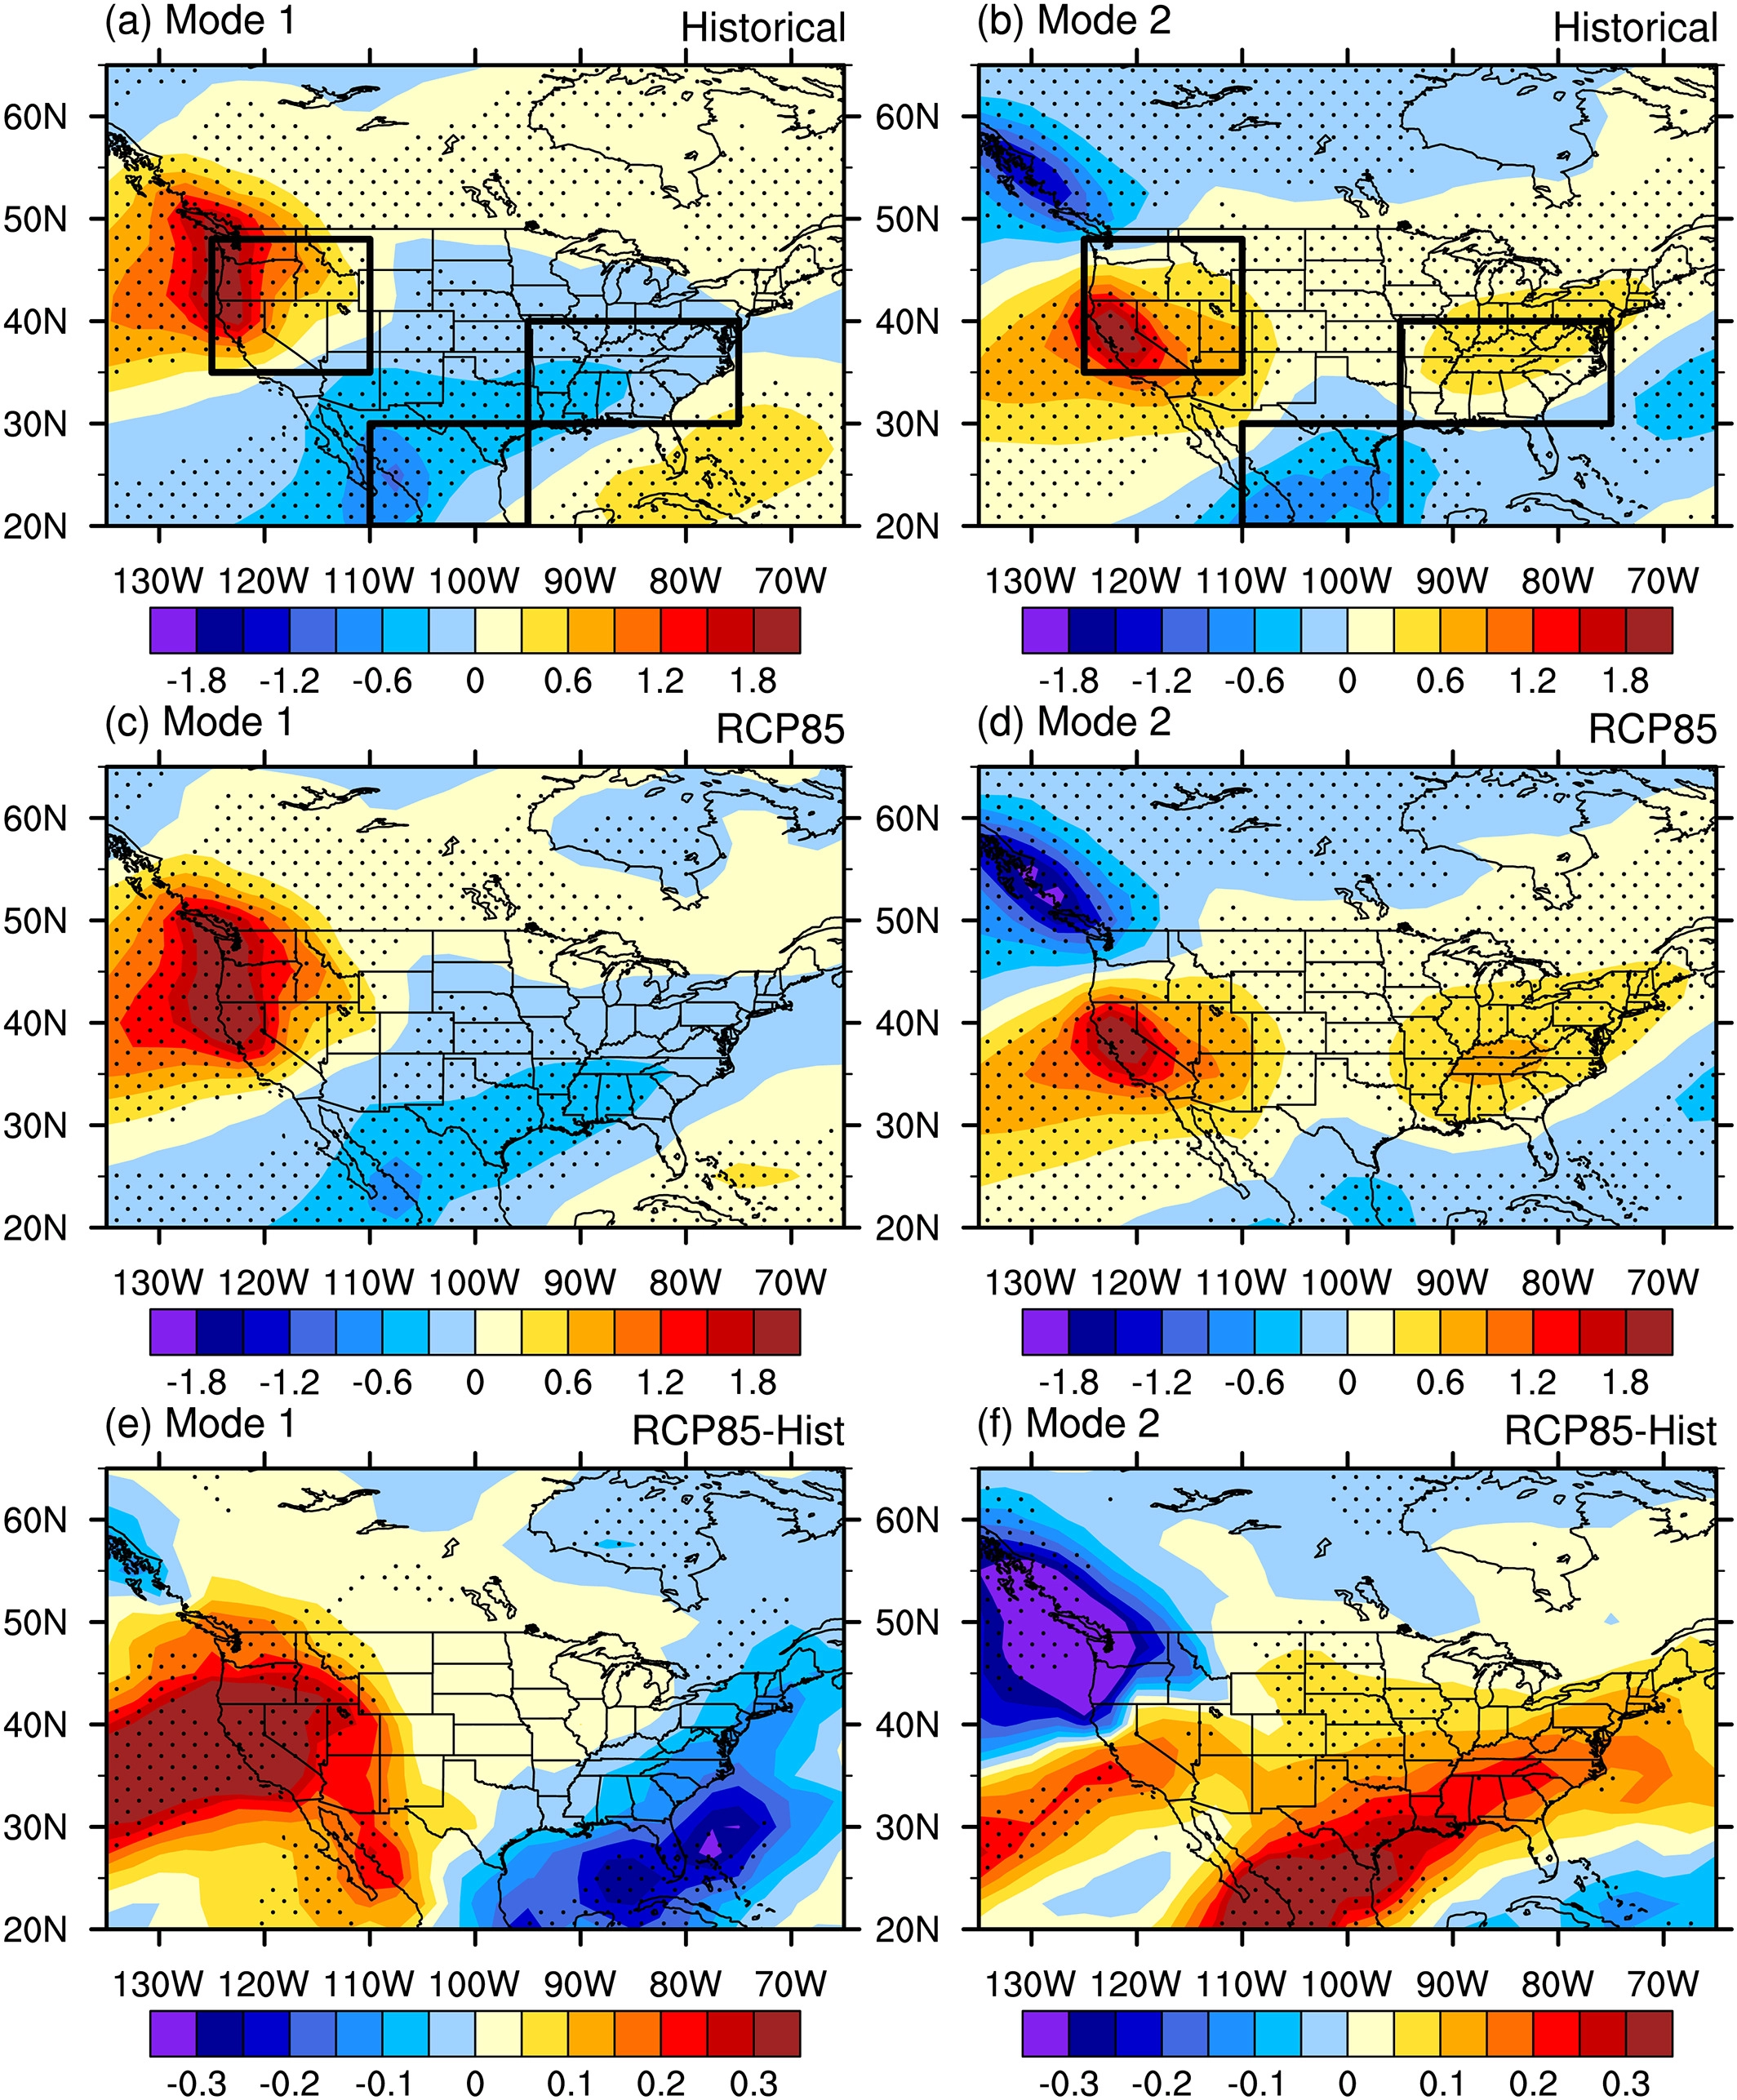
Figure 1, The two leading EOF patterns of subseasonal precipitation (units: mm/day) from (a and b) historical runs during 1976–2005, (c and d) RCP8.5 runs during 2071–2100, and (e and f) future changes between RCP8.5 and Hist during DJF for (left panels) mode 1 and (right panels) mode 2 based on the ensemble mean of 20 CMIP5 models. Stippling indicates that at least 70% of the models agree on the sign of the change.
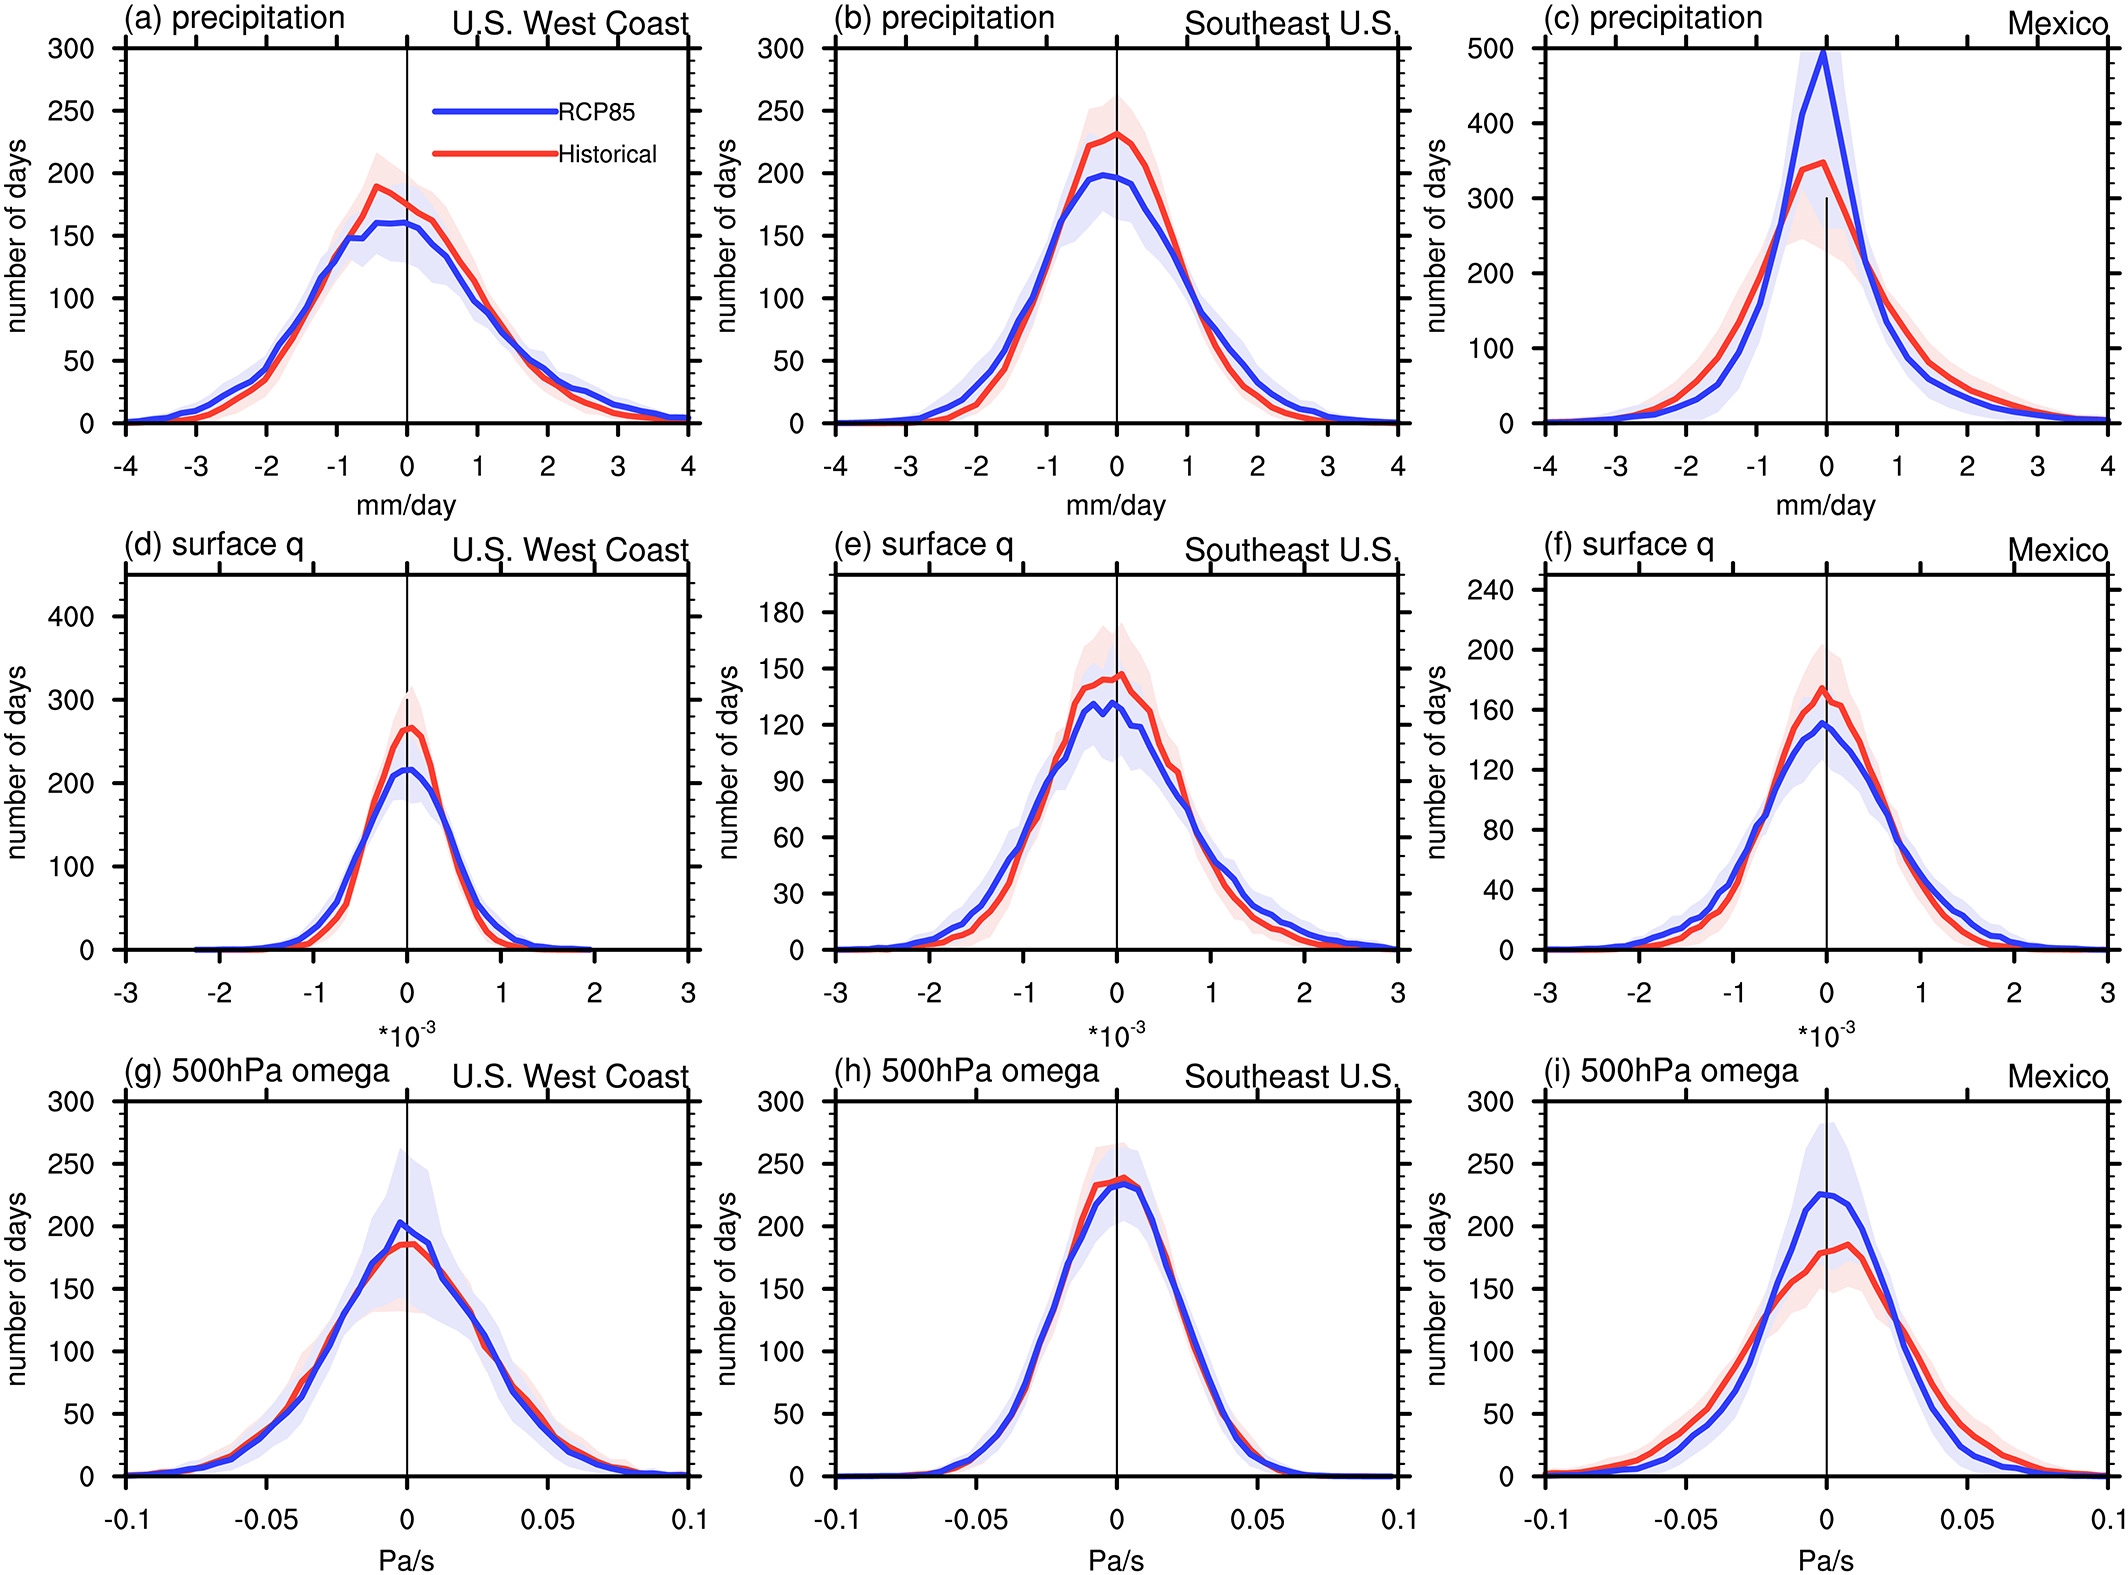
Figure 2, Histograms of area averaged anomalies in (a–c) subseasonal precipitation (mm/day), (d–f) surface specific humidity (×10−3), and (g–i) 500‐hPa omega (Pa/s) in historical (red lines) and RCP8.5 (blue lines) runs based on the ensemble mean of 20 CMIP5 models. (left panels) Averaged over the U.S. West Coast (35–48°N, 110–125°W). (middle panels) Averaged over the southeast United States (30–40°N, 75–95°W). (right panels) Averaged over Mexico (20–30°N, 95–110°W). The three areas are shown as black boxes in Figure 1. The y axis denotes the number of days. The pink/blue shading shows one standard deviation in historical/RCP8.5 runs among the 20 models.
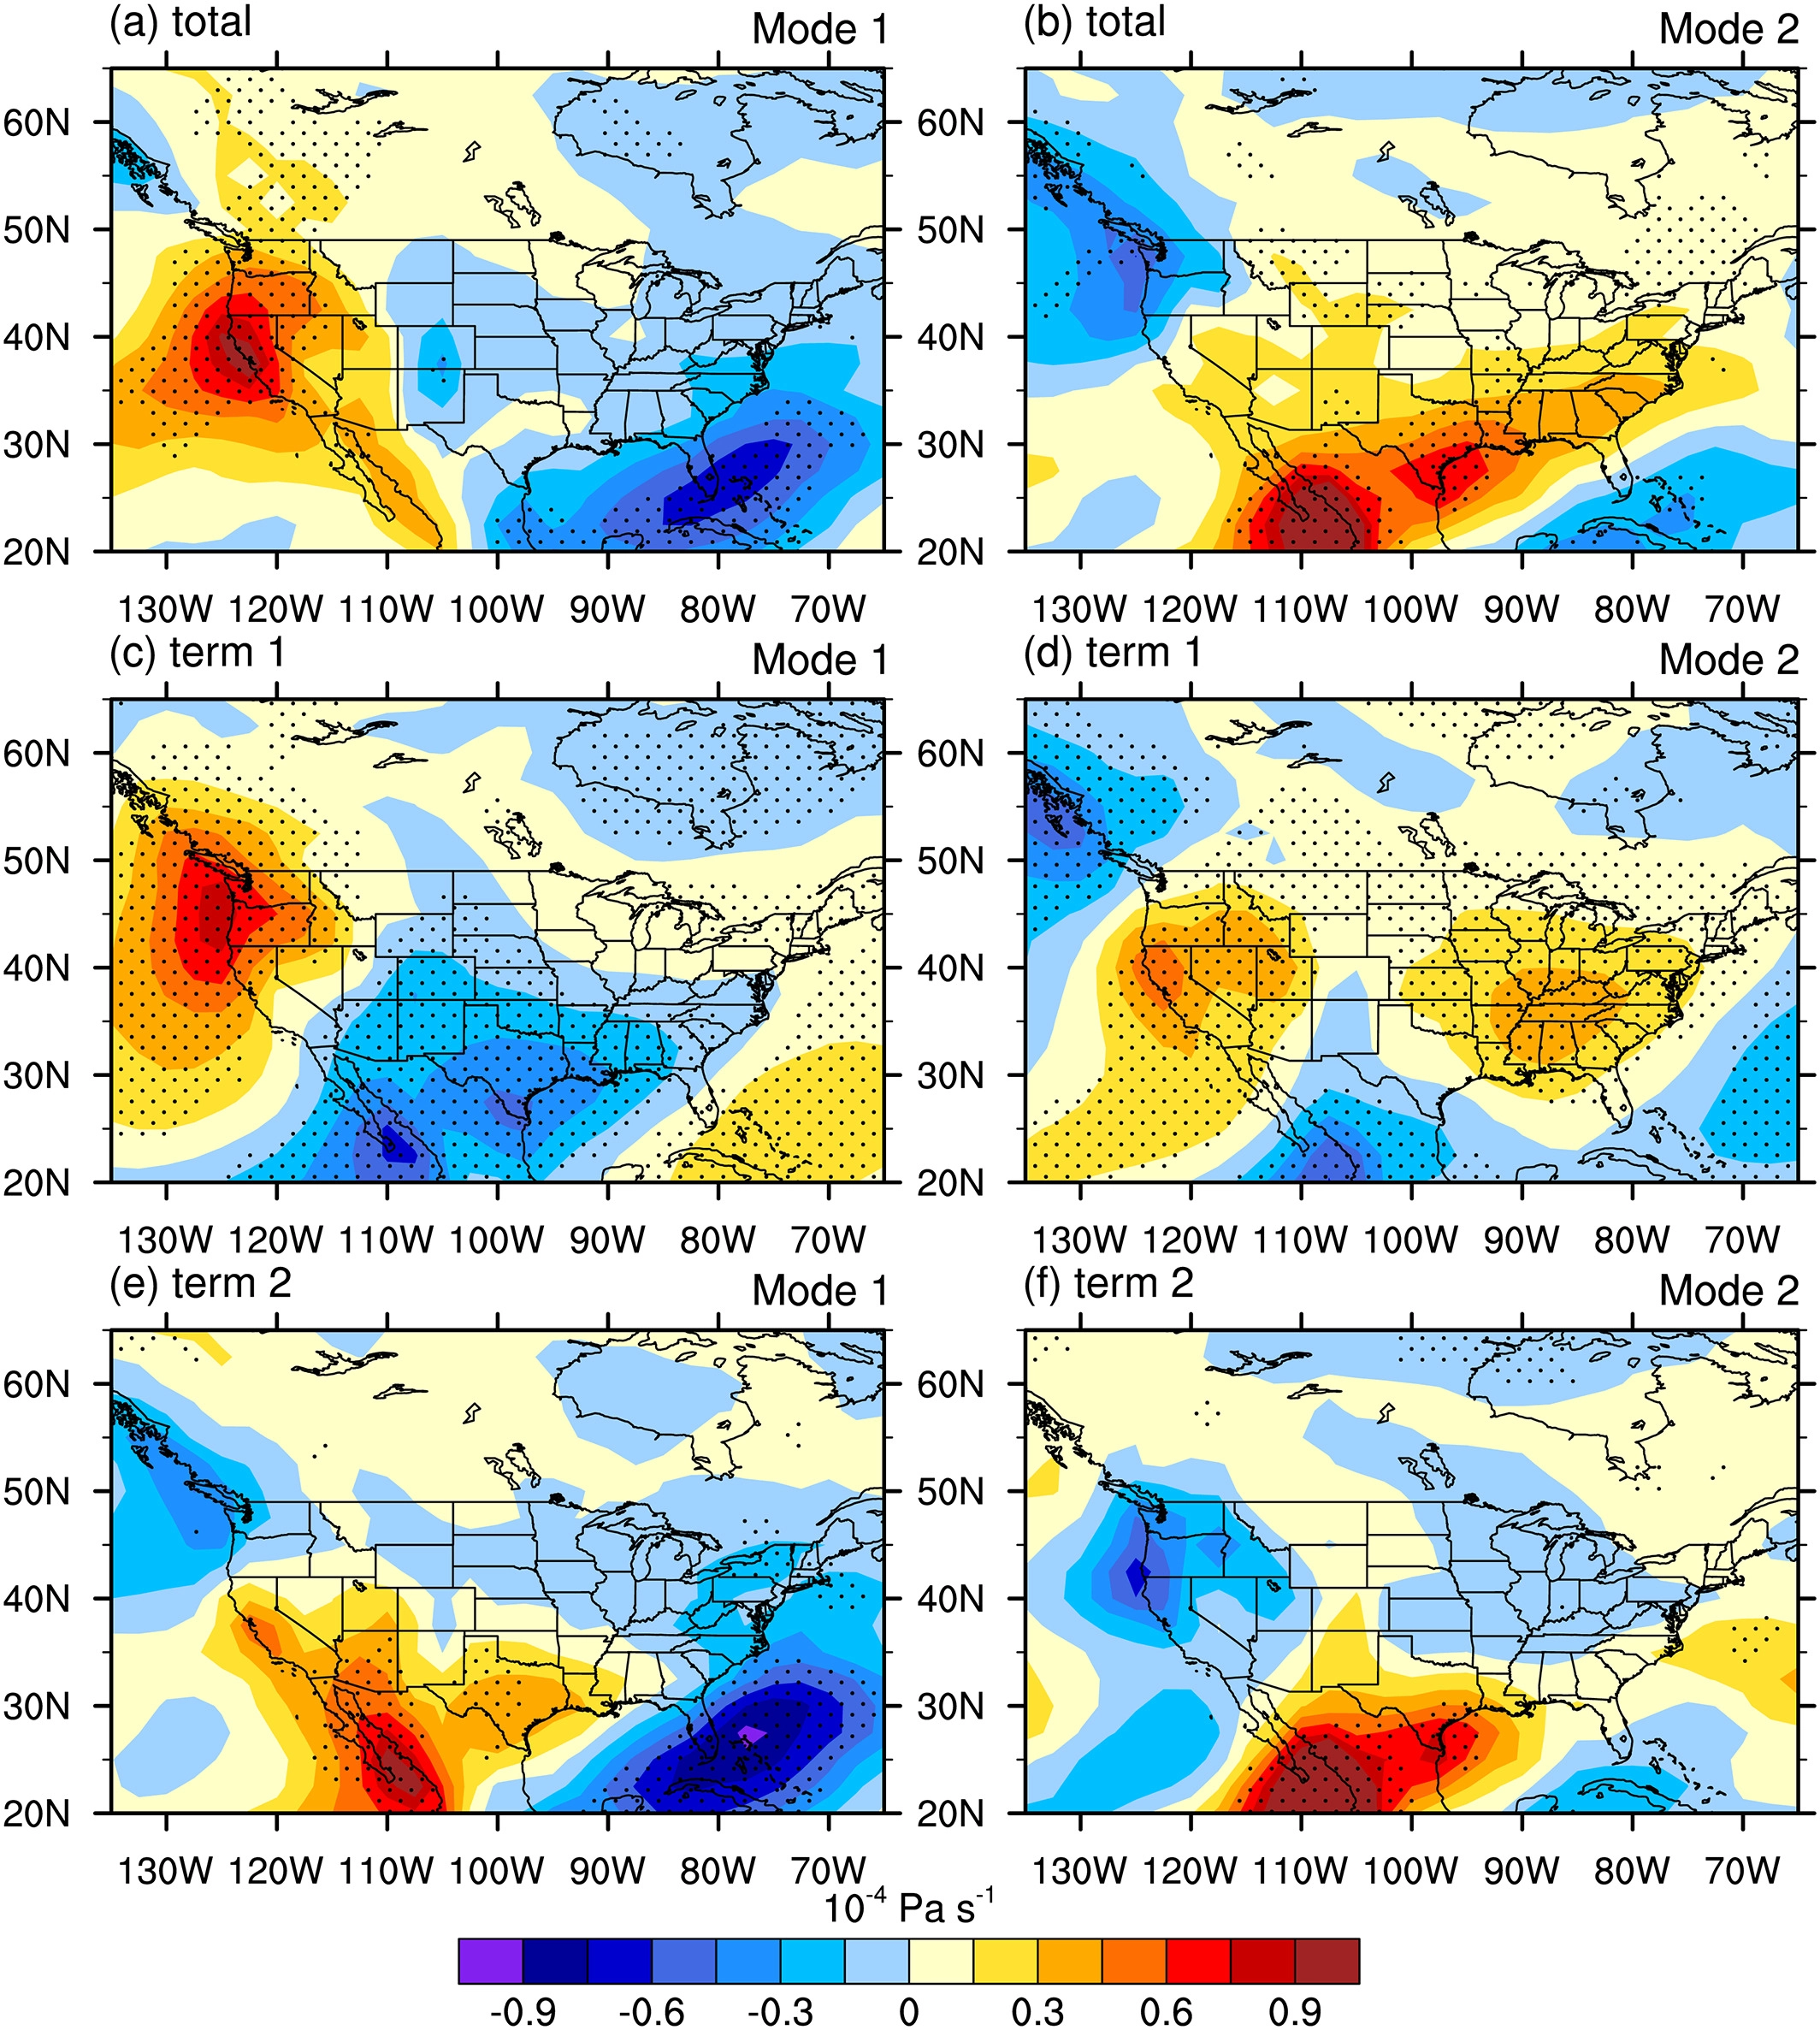
Figure 3, Contributions of (a and b) the sum of the thermodynamic and dynamic components obtained from −Δq · ω′ − q · Δω′ − Δω · q′ − ω · Δq′, (c and d) the thermodynamic component due to changes in background moisture obtained from −Δq · ω′, and (e and f) the dynamic component due to changes in subseasonal precipitation‐related variability of vertical motion obtained from −q · Δω′, in the EOF mode changes of subseasonal precipitation under global warming for (left panels) mode 1 and (right panels) mode 2 based on the ensemble mean of 20 CMIP5 models. Stippling indicates that at least 70% of the models agree on the sign of the changes. Units: ×10−4 Pa/s.
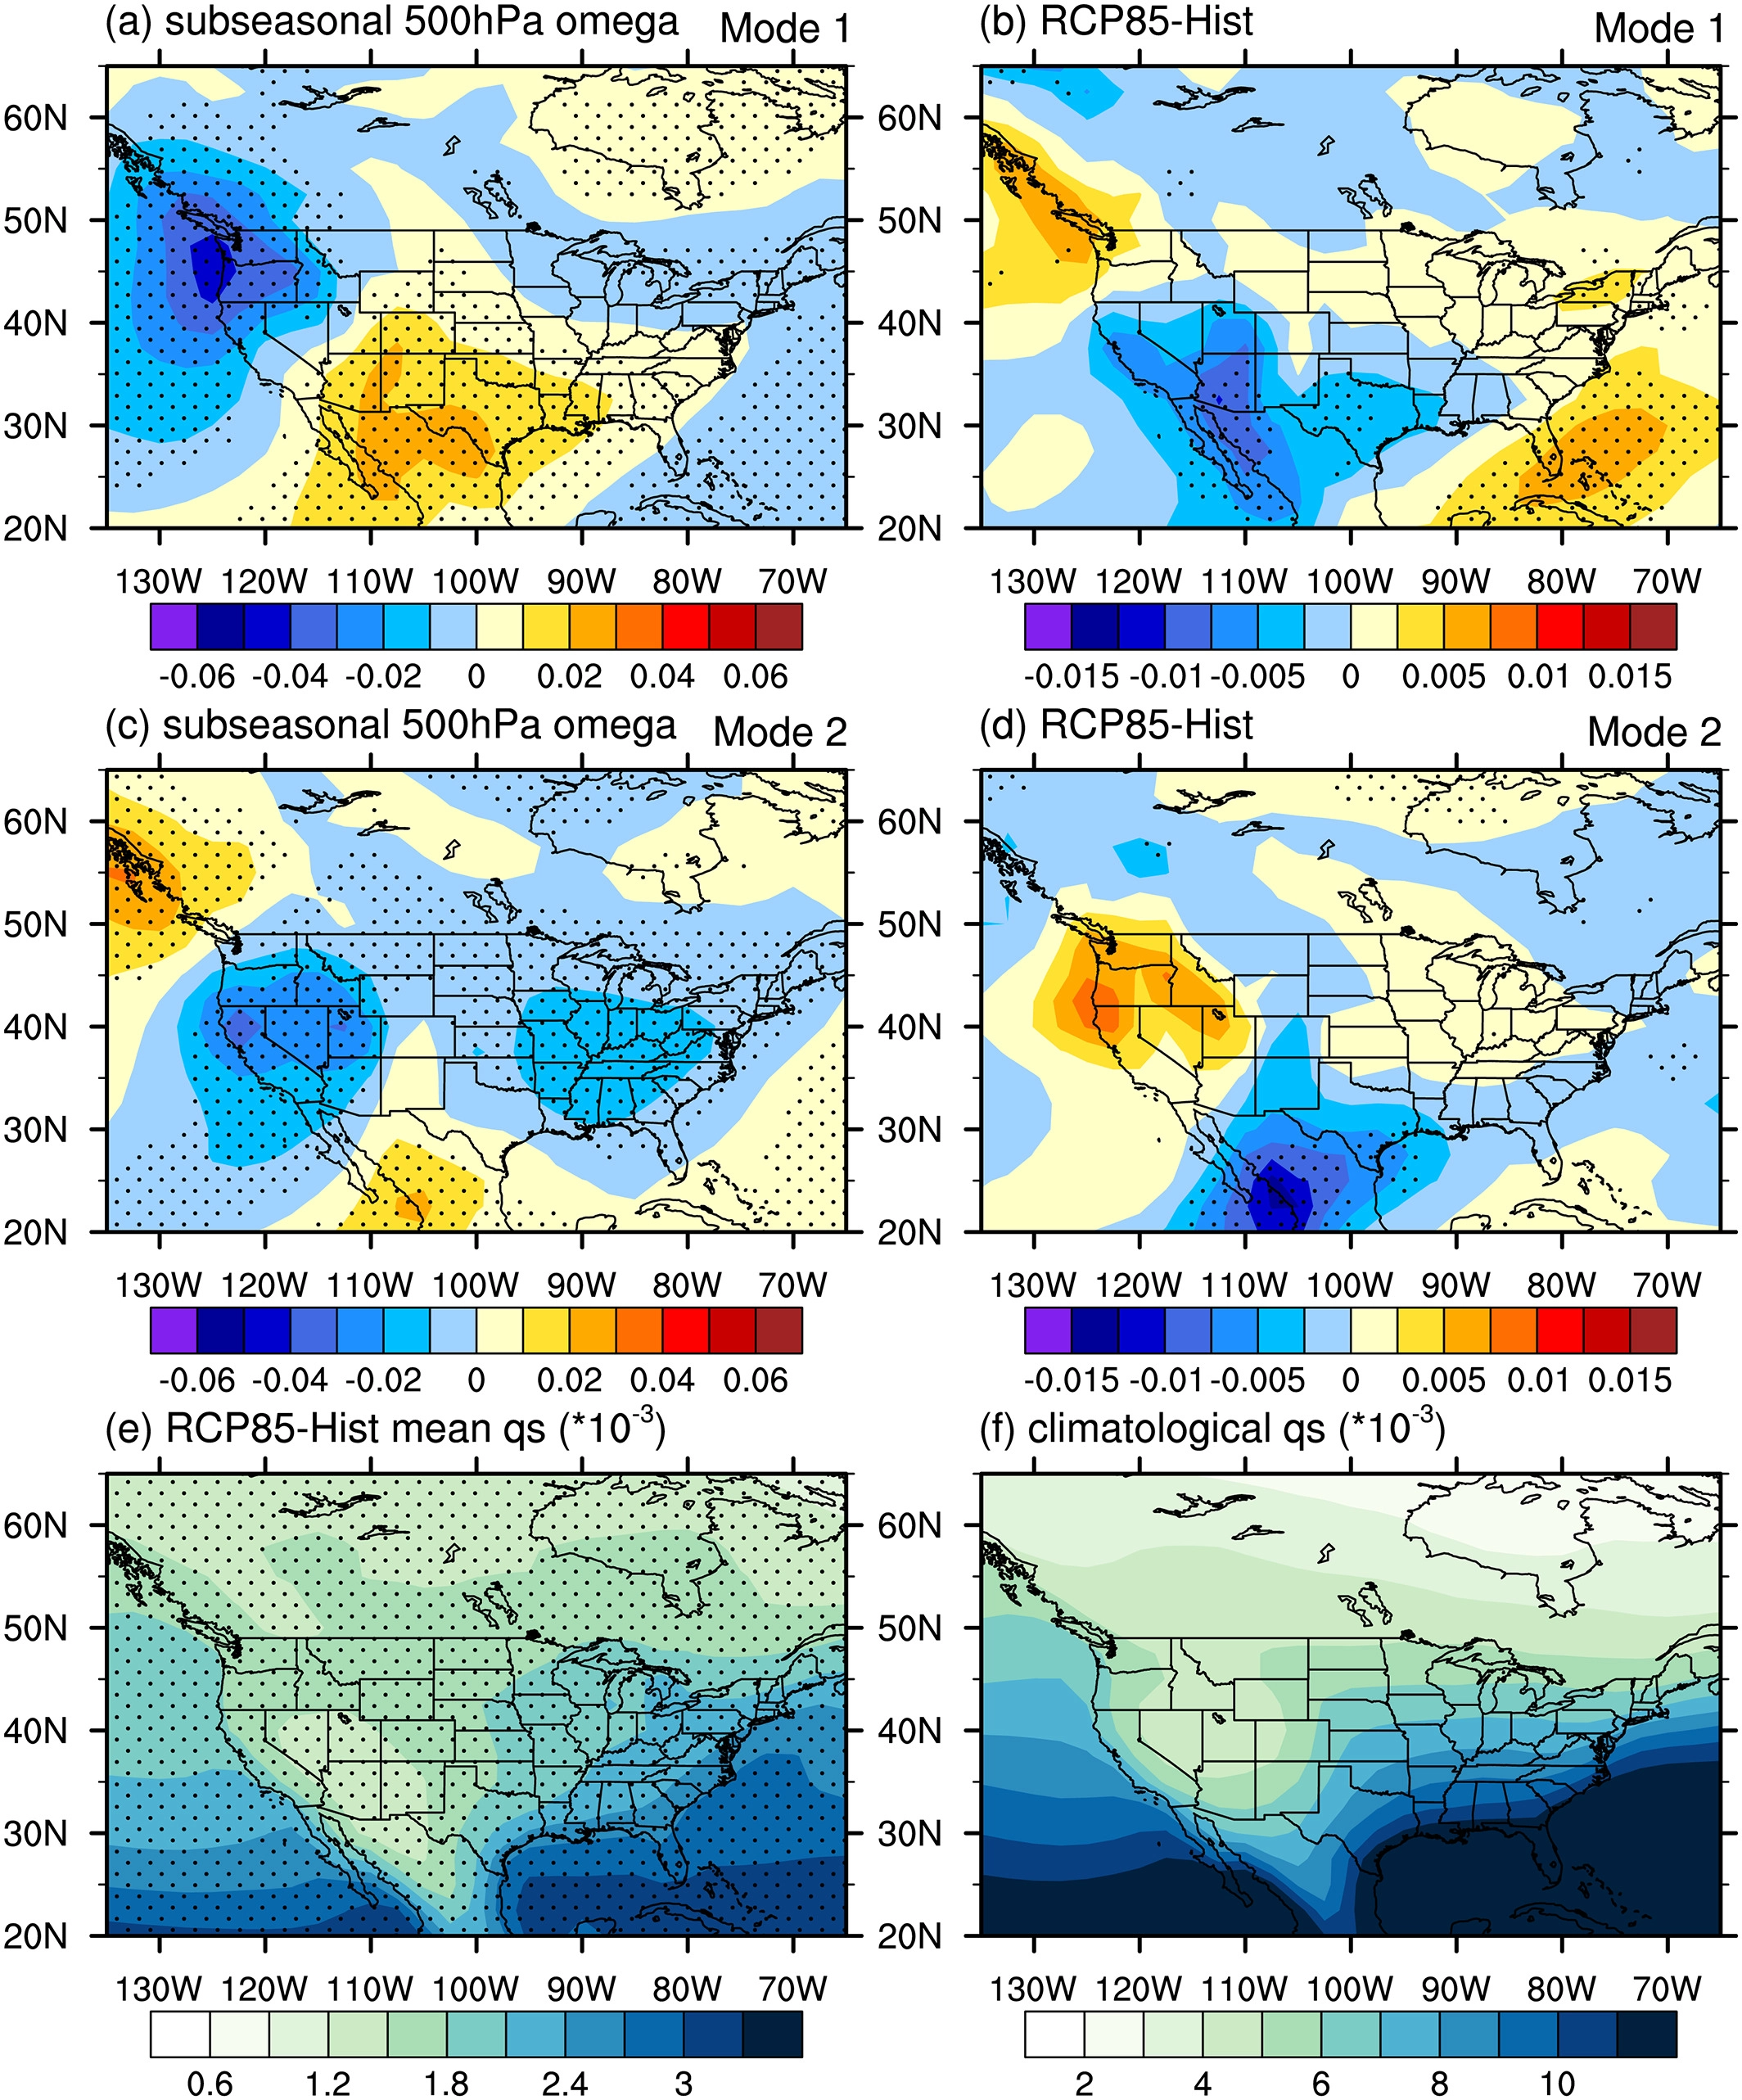
Figure 4, (a) Mode 1 of subseasonal precipitation‐related historical vertical circulation (ω′, in Pa/s) and (b) its changes under global warming between RCP8.5 and Hist (Δω′, in Pa/s). (c and d) The same as in (a) and (b) but for mode 2. (e) Changes in climatological surface specific humidity (×10−3) between RCP8.5 and Hist (Δq). (f) Climatological surface specific humidity (×10−3) in historical runs (q). All the results are based on the ensemble mean of 20 CMIP5 models, and stippling indicates that at least 70% of the models agree on the sign of the changes.