Python绘制气象实用地图(续)

本文在『气象学家』同步推送传送门;上一期对Python绘制气象实用地图做了比较详细的介绍,尽管已经能够满足部分需求了,但是,在实际的应用需求中,可能还是别的需求,那么,今天就手把手教大家如何绘制几个省份的白化等值线contour地图。另外,对上一期进行补充,谈谈一些小技巧。最后,对于QGIS强烈安利一波,不光它是免费的,而且跨平台,也能够完美的支持Python3.7了,能够替代大部分日常使用的ArcGIS功能,用起来不算很笨重!

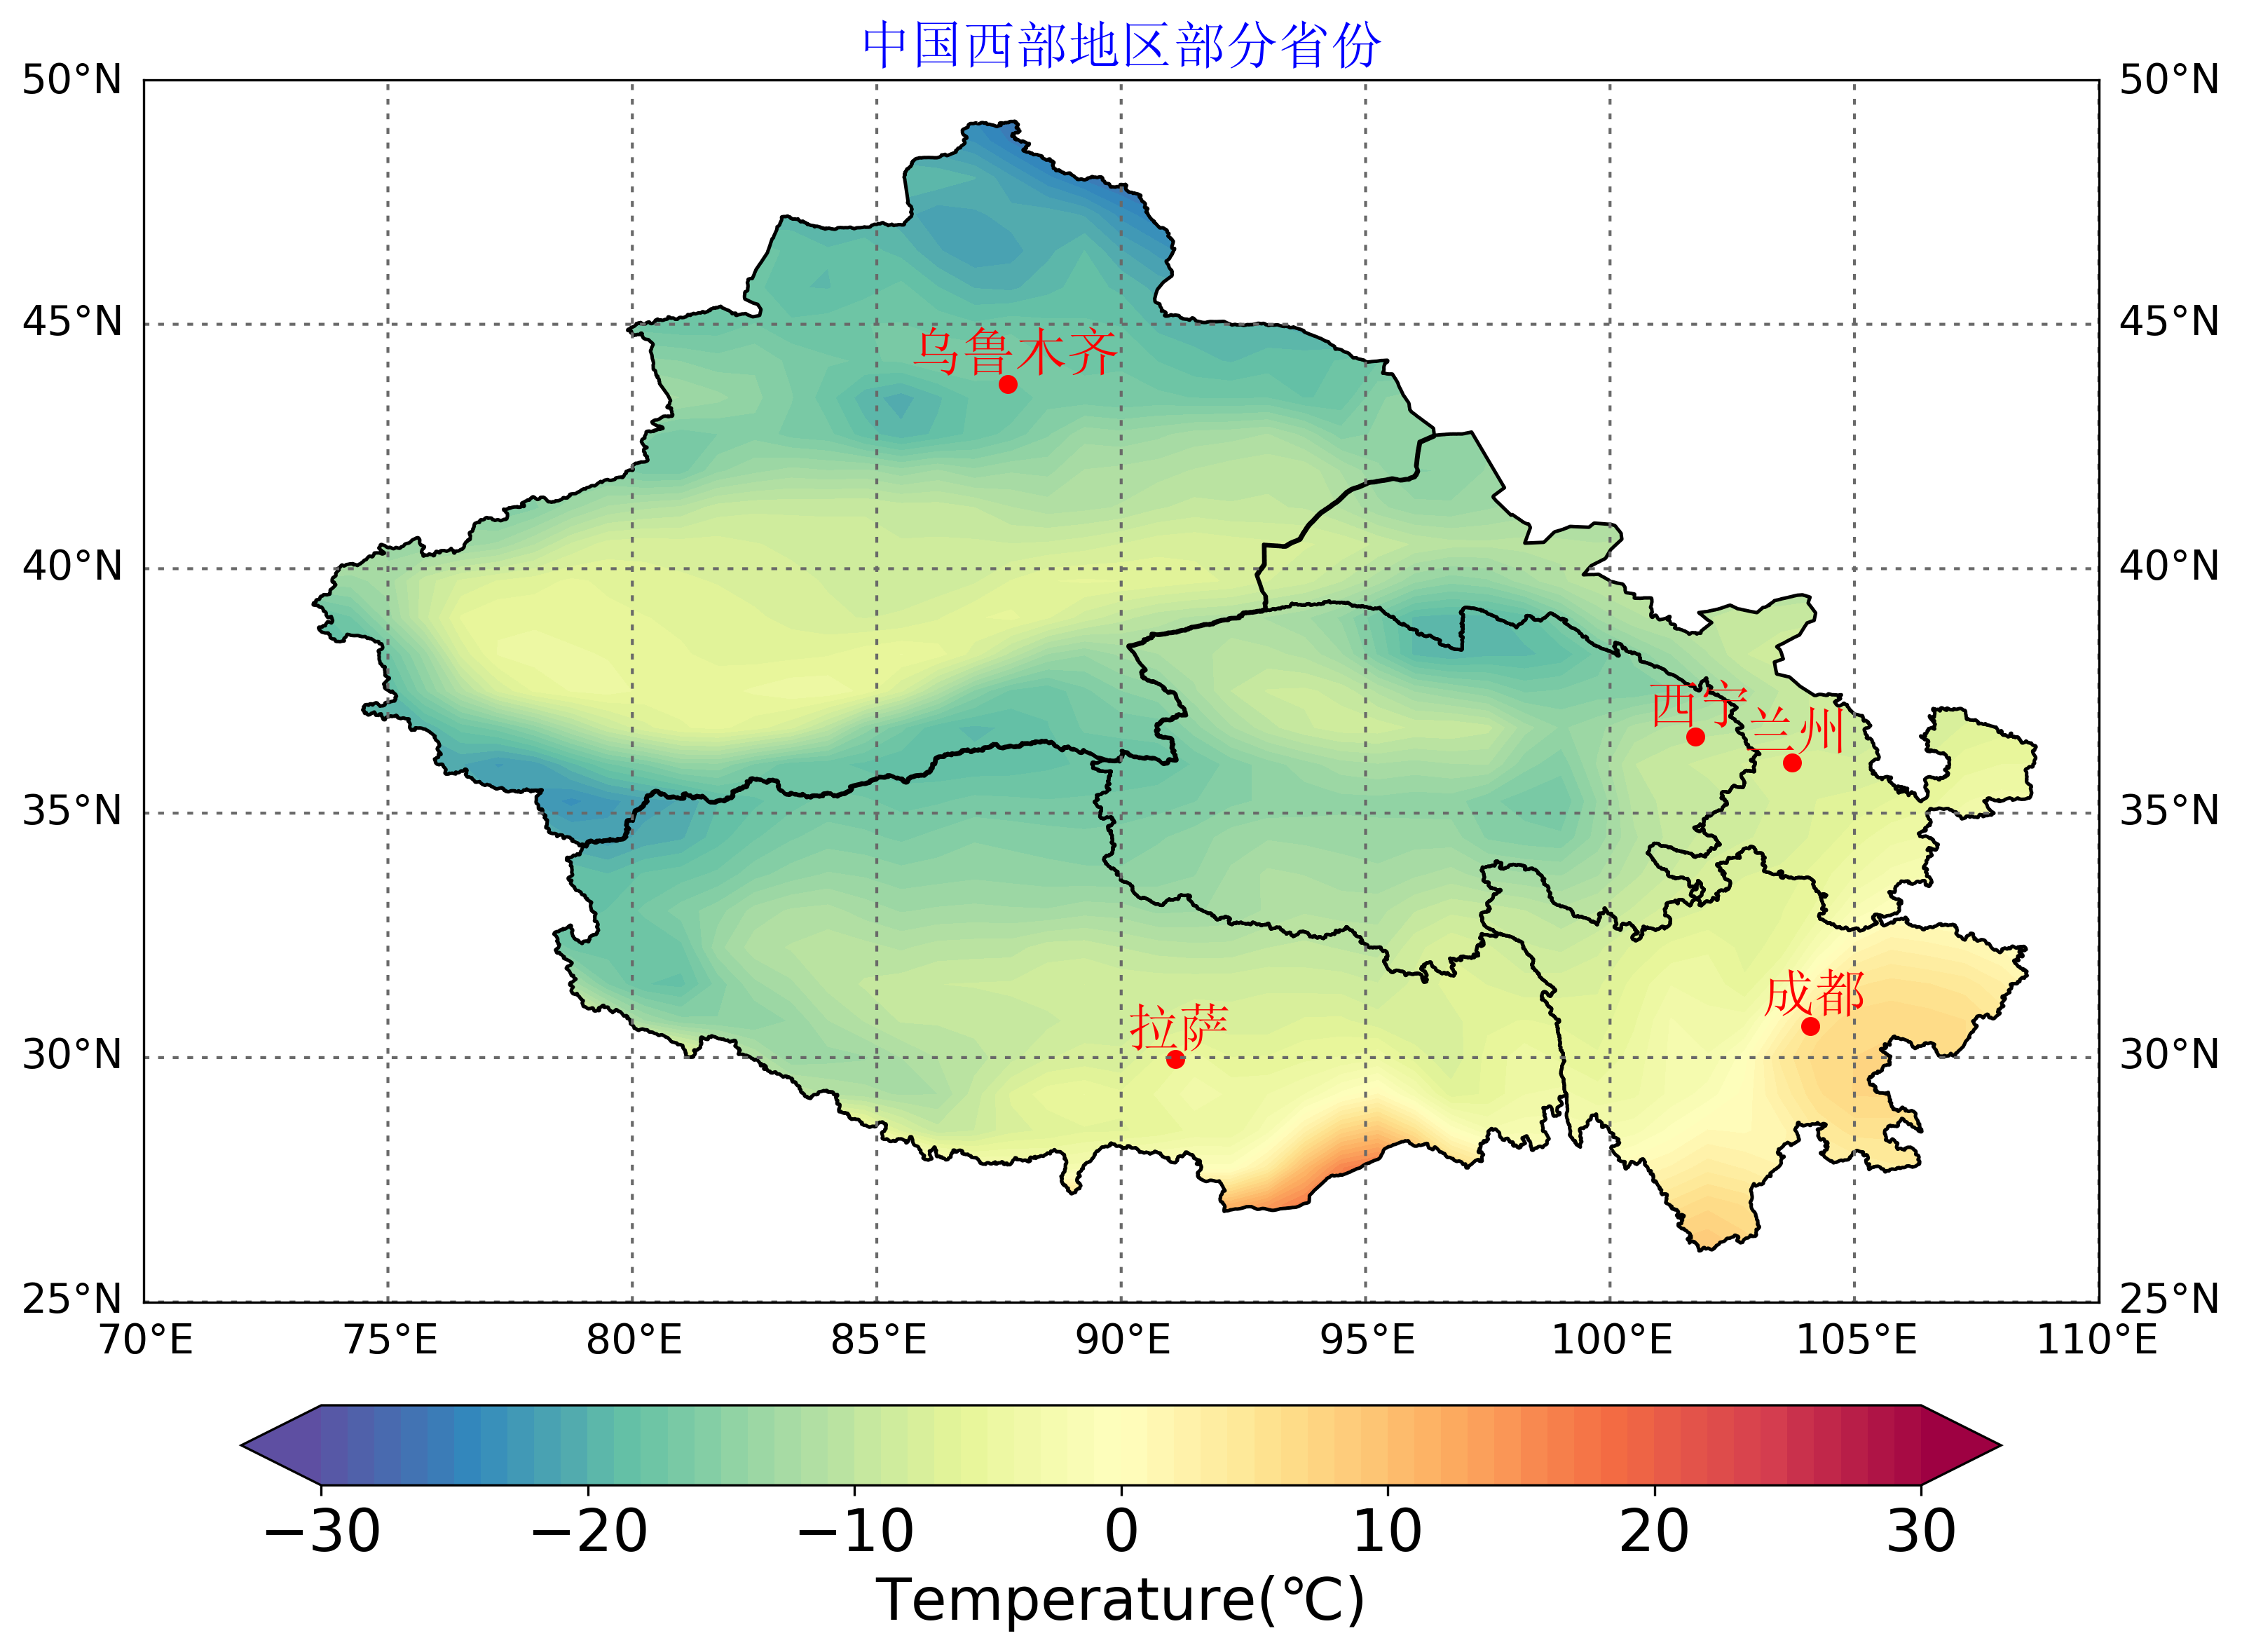
目标:绘制西部的几个省份,并且mask掉其它区域,地图上支持中文,绘制经纬度网格线,附带经纬度信息。
工具:Python3.6+、ArcGIS/QGIS、Shapfile、一系列相关的Python库、测试数据

第一步:制作底图

利用单独省份的Shapefile文件,制作一个shp文件包含新疆、西藏、甘肃、青海、四川,ArcGIS操作很简单不做介绍,至于QGIS我之前基本无从下手,相关的中文资料也很少,还是Google了“how to make shapefile in qgis”得到了解决方案,具体可以参考:链接,该帖子已经比较详细的做了介绍。只不过需要提醒一下,在“Merge Shapefiles”窗口中选中之前一同导入的各省份shp文件之后,窗口会奇怪的置底,需要移开当前界面才会发现其隐藏之处,不是闪退哦!再选定坐标系方案,最好和原来的shp文件一致。我在文末会提供相应的地图文件

第二步:如何调试程序

1.使用jupyter notebook;(推荐)

直接加载如下脚本,然后运行就好,代码附上:

1
2
3
4
5
6
7
8
9
10
11
12
13
14
15
16
17
18
19
20
21
22
23
24
25
26
27
28
29
30
31
32
33
34
35
36
37
38
39
40
41
42
43
44
45
46
47
48
49
50
51
52
53
54
55
56
57
58
59
60
61
62
63
64
65
66
67
68
69
70
71
72
73
74
75
76
77
78
79
80
81
82
83
84
85
86
87
88
89
90
91
92
93
94
95
96
97
98
99
100
101
102
103
104
105
106
107
108
109
110
111
112
113
114
115
116
117
118
119
120
121
122
123
124
125
126
127
128
129
130
131
132
133
134
135
136
#coding=utf-8
from mpl_toolkits.basemap import Basemap
from matplotlib.path import Path
from matplotlib.patches import PathPatch
import matplotlib.pyplot as plt
from osgeo import gdal
import numpy as np
import cartopy.crs as ccrs
import shapefile
import matplotlib as mpl
import xarray as xr
from matplotlib.font_manager import FontProperties
import netCDF4 as nc
from cartopy.mpl.gridliner import LONGITUDE_FORMATTER, LATITUDE_FORMATTER

import matplotlib
ZHfont = matplotlib.font_manager.FontProperties(fname='/Users/zhpfu/Documents/fonts/SimSun.ttf')

plt.rcParams.update({'font.size': 20})
fig = plt.figure(figsize=[12,18])
ax = fig.add_subplot(111)


def basemask(cs, ax, map, shpfile):

sf = shapefile.Reader(shpfile)
vertices = []
codes = []
for shape_rec in sf.shapeRecords():
if shape_rec.record[0] >= 0:
pts = shape_rec.shape.points
prt = list(shape_rec.shape.parts) + [len(pts)]
for i in range(len(prt) - 1):
for j in range(prt[i], prt[i+1]):
vertices.append(map(pts[j][0], pts[j][1]))
codes += [Path.MOVETO]
codes += [Path.LINETO] * (prt[i+1] - prt[i] -2)
codes += [Path.CLOSEPOLY]
clip = Path(vertices, codes)
clip = PathPatch(clip, transform = ax.transData)
for contour in cs.collections:
contour.set_clip_path(clip)


def makedegreelabel(degreelist):
labels=[str(x)+u'°E' for x in degreelist]
return labels


ds = xr.open_dataset('EC-Interim_monthly_2018.nc')
lat = ds.latitude
lon = ds.longitude
data = (ds['t2m'][0,::-1,:] - 273.15) # 把温度转换为℃

# [west,east,south,north]
m = Basemap(llcrnrlon=70.,
llcrnrlat=25,
urcrnrlon=110,
urcrnrlat=50,
resolution = None,
projection = 'cyl')


cbar_kwargs = {
'orientation': 'horizontal',
'label': 'Temperature(℃)',
'ticks': np.arange(-30,30+1,10),
'pad': -0.35,
'shrink': 0.9
}

# 画图
levels = np.arange(-30,30+1,1)
cs = data.plot.contourf(ax=ax,levels=levels,cbar_kwargs=cbar_kwargs, cmap='Spectral_r')

m.readshapefile('west','West',color='k',linewidth=1.2)
basemask(cs, ax, m, 'west')


# draw parallels and meridians.
# label parallels on right and top
# meridians on bottom and left
parallels = np.arange(25.,50.+1,5.)
# labels = [left,right,top,bottom]
m.drawparallels(parallels,labels=[True,True,True,True],color='dimgrey',dashes=[2, 3],fontsize= 14) # ha= 'right'
meridians = np.arange(70.,110.+1,5.)
m.drawmeridians(meridians,labels=[True,True,False,True],color='dimgrey',dashes=[2, 3],fontsize= 14)

plt.ylabel('') #Remove the defult lat / lon label
plt.xlabel('')


plt.rcParams.update({'font.size':25})
ax.set_title(u'中国西部地区部分省份',color='blue',fontsize= 25 ,fontproperties=ZHfont) # 2m Temperature

#经度:87.68 , 纬度:43.77
bill0 = 87.68
tip0 = 43.77
plt.scatter(bill0, tip0,marker='.',s=120 ,color ="r",zorder=2)

#经度:103.73 , 纬度:36.03
bill1 = 103.73
tip1 = 36.03
plt.scatter(bill1, tip1,marker='.',s=120 ,color ="r" ,zorder=2)

#经度:101.74 , 纬度:36.56
bill2 = 101.74
tip2 = 36.56
plt.scatter(bill2, tip2,marker='.',s=120 ,color ="r",zorder=2 )


bill3 = 104.1
tip3 = 30.65
plt.scatter(bill3, tip3,marker='.',s=120 ,color ="r",zorder=2 )


bill4 = 91.11
tip4 = 29.97

plt.scatter(bill4, tip4,marker='.',s=120 ,color ="r",zorder=2)


plt.rcParams.update({'font.size':18})

plt.text(bill0-2.0, tip0+0.3, u"乌鲁木齐",fontsize= 18 ,color ="r",fontproperties=ZHfont)
plt.text(bill1-1., tip1+0.3, u"兰州" ,fontsize= 18 ,color ="r",fontproperties=ZHfont)
plt.text(bill2-1., tip2+0.3, u"西宁" ,fontsize= 18 ,color ="r",fontproperties=ZHfont)
plt.text(bill3-1., tip3+0.3, u"成都" ,fontsize= 18 ,color ="r",fontproperties=ZHfont)
plt.text(bill4-1., tip4+0.3, u"拉萨" ,fontsize= 18 ,color ="r",fontproperties=ZHfont)


# Save & Show figure
plt.savefig("West_China_mask.png", dpi=300, bbox_inches='tight')
plt.show()

出图效果:

2.直接在终端使用python xxx.py运行;

需要注意的地方:很多人发现输出的图片是没有经纬度的坐标信息附加在网格线两端的,怎么调都还是出不来。并且若是设置为出图显示,还会发现绘制的图怎么都挪不到最顶层。这个问题怎么解决?答案是,在脚本最顶部添加两行:

1
2
3
4
5
6
#代码头部
import os,sys

#代码尾部
(filename, extension) = os.path.splitext(os.path.basename(sys.argv[0]))
plt.savefig(filename+".png", dpi=600, bbox_inches='tight')

你会发现看图置顶的问题解决了,而且网格线两端也会正常出现经纬度信息。当然,jupyter notebook是不会出现这个问题的。至于什么原因大家可以去自行了解一下。还是那句话,遇到错误信息了,最值得信赖的还是Google大法,学会如何使用Google,绝对是对debug有极大好处的。
代码附上:

1
2
3
4
5
6
7
8
9
10
11
12
13
14
15
16
17
18
19
20
21
22
23
24
25
26
27
28
29
30
31
32
33
34
35
36
37
38
39
40
41
42
43
44
45
46
47
48
49
50
51
52
53
54
55
56
57
58
59
60
61
62
63
64
65
66
67
68
69
70
71
72
73
74
75
76
77
78
79
80
81
82
83
84
85
86
87
88
89
90
91
92
93
94
95
96
97
98
99
100
101
102
103
104
105
106
107
108
109
110
111
112
113
114
115
116
117
118
119
120
121
122
123
124
125
126
127
128
129
130
131
132
133
134
135
136
137
138
139
140
#coding=utf-8
import matplotlib
matplotlib.use('TkAgg')
import os,sys
from mpl_toolkits.basemap import Basemap
from matplotlib.path import Path
from matplotlib.patches import PathPatch
import matplotlib.pyplot as plt
from osgeo import gdal
import numpy as np
import cartopy.crs as ccrs
import shapefile
import matplotlib as mpl
import xarray as xr
from matplotlib.font_manager import FontProperties
import netCDF4 as nc
from cartopy.mpl.gridliner import LONGITUDE_FORMATTER, LATITUDE_FORMATTER

import matplotlib
ZHfont = matplotlib.font_manager.FontProperties(fname='/Users/zhpfu/Documents/fonts/SimSun.ttf')

plt.rcParams.update({'font.size': 20})
fig = plt.figure(figsize=[12,18])
ax = fig.add_subplot(111)


def basemask(cs, ax, map, shpfile):

sf = shapefile.Reader(shpfile)
vertices = []
codes = []
for shape_rec in sf.shapeRecords():
if shape_rec.record[0] >= 0:
pts = shape_rec.shape.points
prt = list(shape_rec.shape.parts) + [len(pts)]
for i in range(len(prt) - 1):
for j in range(prt[i], prt[i+1]):
vertices.append(map(pts[j][0], pts[j][1]))
codes += [Path.MOVETO]
codes += [Path.LINETO] * (prt[i+1] - prt[i] -2)
codes += [Path.CLOSEPOLY]
clip = Path(vertices, codes)
clip = PathPatch(clip, transform = ax.transData)
for contour in cs.collections:
contour.set_clip_path(clip)


def makedegreelabel(degreelist):
labels=[str(x)+u'°E' for x in degreelist]
return labels


ds = xr.open_dataset('EC-Interim_monthly_2018.nc')
lat = ds.latitude
lon = ds.longitude
data = (ds['t2m'][0,::-1,:] - 273.15) # 把温度转换为℃

# [west,east,south,north]
m = Basemap(llcrnrlon=70.,
llcrnrlat=25,
urcrnrlon=110,
urcrnrlat=50,
resolution = None,
projection = 'cyl')


cbar_kwargs = {
'orientation': 'horizontal',
'label': 'Temperature(℃)',
'ticks': np.arange(-30,30+1,10),
'pad': -0.35,
'shrink': 0.9
}

# 画图
levels = np.arange(-30,30+1,1)
cs = data.plot.contourf(ax=ax,levels=levels,cbar_kwargs=cbar_kwargs, cmap='Spectral_r')

m.readshapefile('west','West',color='k',linewidth=1.2)
basemask(cs, ax, m, 'west')


# draw parallels and meridians.
# label parallels on right and top
# meridians on bottom and left
parallels = np.arange(25.,50.+1,5.)
# labels = [left,right,top,bottom]
m.drawparallels(parallels,labels=[True,True,True,True],color='dimgrey',dashes=[2, 3],fontsize= 14) # ha= 'right'
meridians = np.arange(70.,110.+1,5.)
m.drawmeridians(meridians,labels=[True,True,False,True],color='dimgrey',dashes=[2, 3],fontsize= 14)

plt.ylabel('') #Remove the defult lat / lon label
plt.xlabel('')


plt.rcParams.update({'font.size':25})
ax.set_title(u'中国西部地区部分省份',color='blue',fontsize= 25 ,fontproperties=ZHfont) # 2m Temperature

#经度:87.68 , 纬度:43.77
bill0 = 87.68
tip0 = 43.77
plt.scatter(bill0, tip0,marker='.',s=120 ,color ="r",zorder=2)

#经度:103.73 , 纬度:36.03
bill1 = 103.73
tip1 = 36.03
plt.scatter(bill1, tip1,marker='.',s=120 ,color ="r" ,zorder=2)

#经度:101.74 , 纬度:36.56
bill2 = 101.74
tip2 = 36.56
plt.scatter(bill2, tip2,marker='.',s=120 ,color ="r",zorder=2 )


bill3 = 104.1
tip3 = 30.65
plt.scatter(bill3, tip3,marker='.',s=120 ,color ="r",zorder=2 )


bill4 = 91.11
tip4 = 29.97

plt.scatter(bill4, tip4,marker='.',s=120 ,color ="r",zorder=2)


plt.rcParams.update({'font.size':18})

plt.text(bill0-2.0, tip0+0.3, u"乌鲁木齐",fontsize= 18 ,color ="r",fontproperties=ZHfont)
plt.text(bill1-1., tip1+0.3, u"兰州" ,fontsize= 18 ,color ="r",fontproperties=ZHfont)
plt.text(bill2-1., tip2+0.3, u"西宁" ,fontsize= 18 ,color ="r",fontproperties=ZHfont)
plt.text(bill3-1., tip3+0.3, u"成都" ,fontsize= 18 ,color ="r",fontproperties=ZHfont)
plt.text(bill4-1., tip4+0.3, u"拉萨" ,fontsize= 18 ,color ="r",fontproperties=ZHfont)


# Save & Show figure
(filename, extension) = os.path.splitext(os.path.basename(sys.argv[0]))
plt.savefig(filename+".png", dpi=600, bbox_inches='tight')
plt.show()

地图、测试数据链接

链接:https://pan.baidu.com/s/1cTIk6j0E0SMpZZkdIG-_tg 密码:9g31

参考:

链接.1
链接.2

有任何问题都欢迎交流探讨,共同学习进步!


-------------本文结束 感谢阅读-------------
作者Gavin
有问题请在相应页面留言(评论系统DISQUS需要"翻墙"才可见)
或者私信给我 GMAIL: zhpfu.atm@gmail.com
满分是10分的话,这篇文章你给几分
--> -->