本文同步发布于公众号『气象学家』传送门。NCL中丰富的Color Table,而在Python中matplotlib绘图工具包中默认的类型可能略显不足。所以,今天介绍一下Dr.🐱开源的cmaps库,即可将NCL的丰富多彩,完美地引入到Python绘图中来。另外,给Dr.🐱“打广告”,欢迎在GitHub(<<项目地址>>https://github.com/hhuangwx/cmaps)上Star或Fork.
cmaps简介
Make it easier to use user defined colormaps in matplotlib. Default colormaps are from NCL website.
Users can define a environmental variable CMAP_DIR pointing to the folder containing the self-defined rgb files.
安装 Installation
pip install https://github.com/hhuangwx/cmaps/archive/master.zip
or:
git clone https://github.com/hhuangwx/cmaps.gitcd cmapspython setup.py install
使用 Usage
1 | import matplotlib.pyplot as plt |

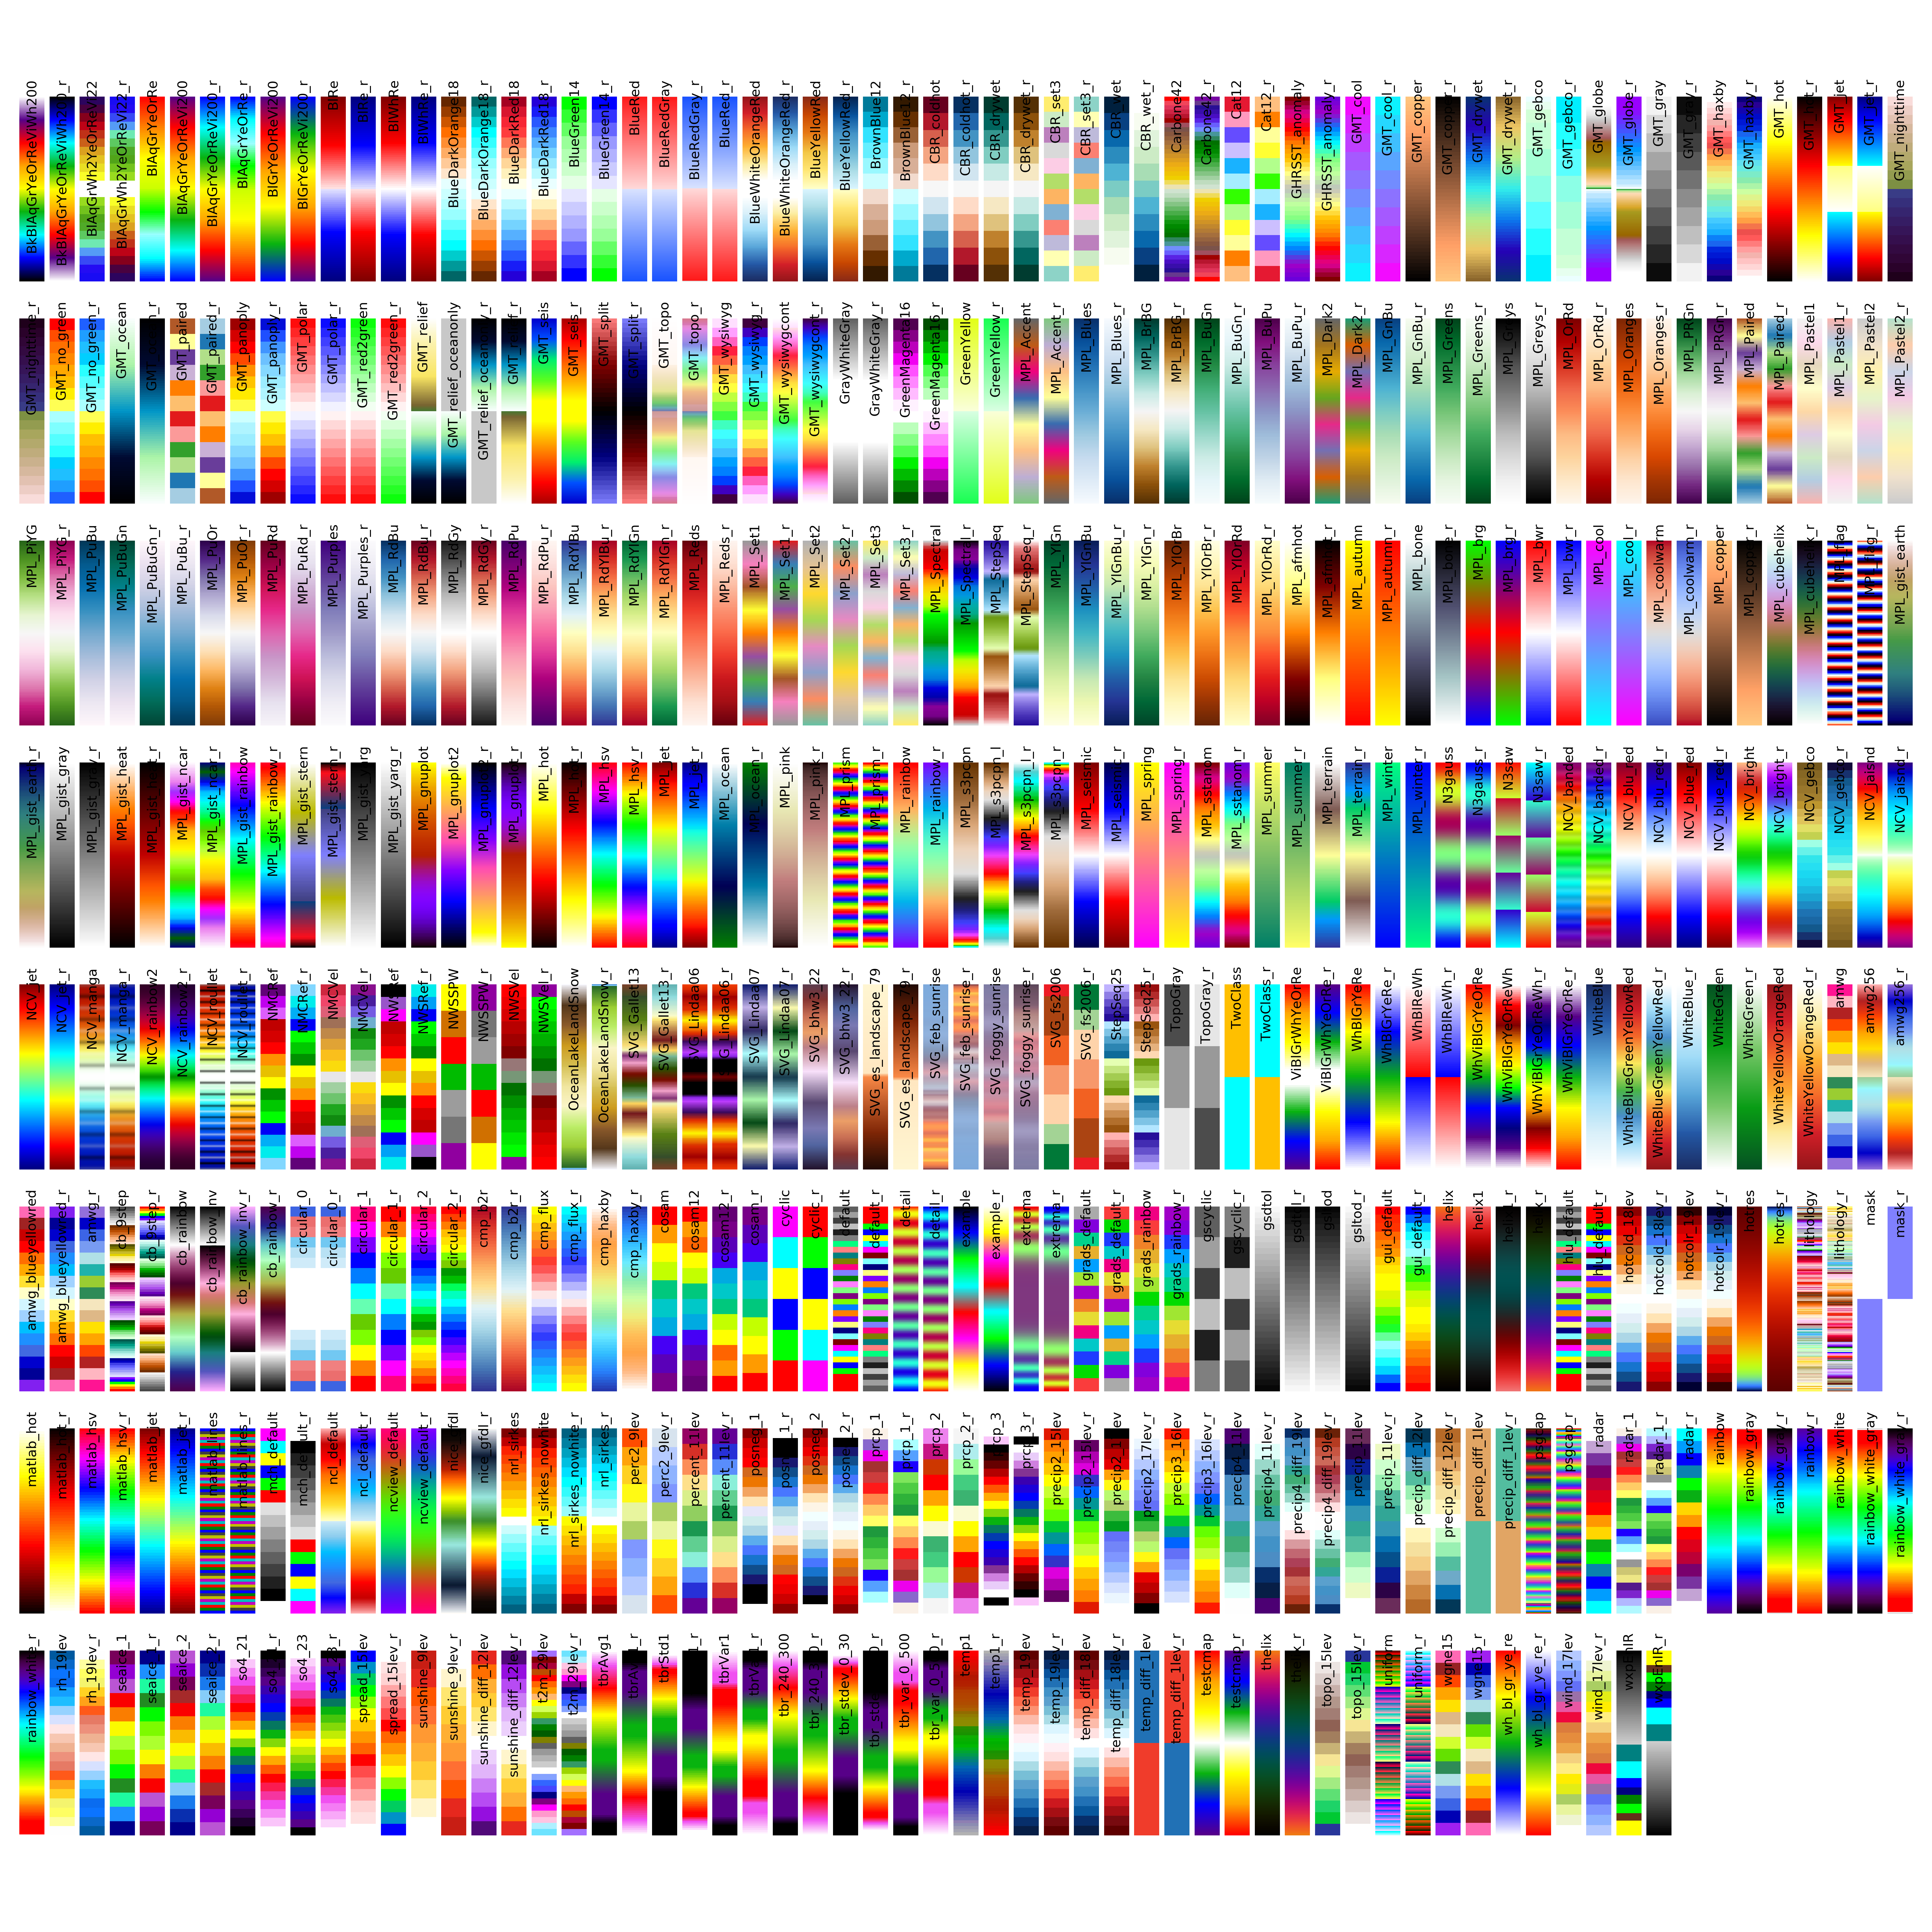
罗列色图
List the colormaps using the code in the examples:
1 | import cmaps |
参考:
有任何问题都欢迎交流探讨,共同学习进步!